Jaso: Target 26.58 to 29.88
ABK: Watch for bump and run break out over 2.85.
GOT: Confirmed breakout from descending triangle. Target 3.40.
Always perform your own due diligence before making any investment.
Monday, June 16, 2008
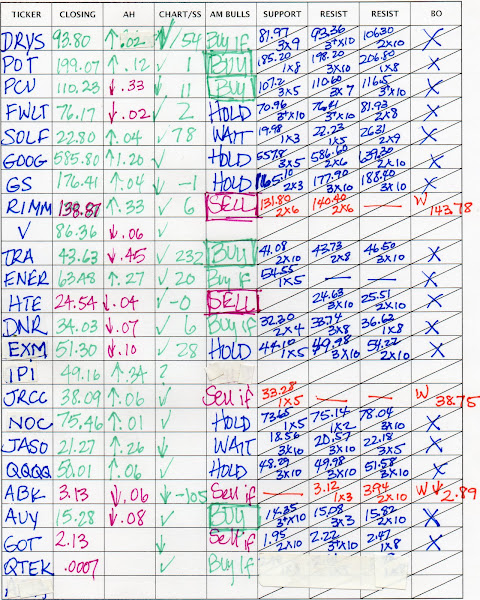
Chart Trading Ideas
HTE confirmed breakout 6/16/08
It looks like HTE had confirmed a double bottom but then had a throw back, which formed a symmetrical triangle. HTE broke out of the symmetrical triangle today. If you are going to play HTE I suggest avoiding the options, there is not a lot of interest, and the stock pays you a .30 dividend monthly while the pattern unfolds.
Target range 26.97-28.20
Click image to enlarge.

Last year HTE peaked at 29.84 on 7/16.
Click image to enlarge.

HTE is one of the stocks I track daily. Click here for more HTE research.
Always perform your own due diligence before making any investment.
Sunday, June 15, 2008
Chart Education Part 2 ~ Symmetrical Triangle ~ Google
Symmetrical triangles don't seem to have a lot of sex appeal, but they do seem to be appearing in several of the stocks in my portfolio, so I have decided that this is the next pattern that I will spend some time studying. The information in this post comes from my copy of Encyclopedia of Chart Patterns by Thomas Bulkowski.
A symmetrical triangle is formed when the stock moves within a trading channel forming higher lows and lower highs as it progressive, giving a top trend line that is angled down, and a bottom trend line that is angled upward. Unlike some of the other patterns that I have studied, confirmation does not occur when the price paces a certain point. Confirmation occurs when the price touches the trend line at least twice on the top and twice on the bottom. By that criteria GOOG is already in a symmetrical triangle pattern, and we are waiting for the breakout. Also the price must cross the triangle several times, covering the white space.
Volume pattern tends to have a downward slope to it. I've drawn a line on the volume portion of the graph that is sloping downward, but it has only has 8 points actually touching the line. The last few days have volume going over the line. Look for trades with heavy volume on the breakout for maximum reward.
Breakout direction can be in any direction, including horizontal, but 54% of the time it will follow the prevailing price trend, which in the case of Google is upward.
Minimum length for a symmetrical triangle is 3 weeks.
Failures: When the price moves less than 5% and then returns to the triangle and then breaks out in the opposite direction, the move in the new direction is likely to be large. These failures occur just over 1/2 the time. Look for resistance/support (depending on breakout direction) before initiating your trade.
Before pronouncing a chart a symmetrical triangle look to the left. A mirror image may be a diamond top or bottom formation. Another minor high to the left of the triangle could be a head and shoulders formation. Both are more powerful formations, so make sure not to miss them.
On average, this pattern gives a 31% rise or decline, and 1/3 of the time you will get a 45% rise or decline.
As with EEDT, busted symmetrical triangle breakouts actually perform better. If you get a pull back after 5% or less move in one direction or the other, and then the price breaks out in the other direction, you definitely want to play that movement.
To get a conservative target price, subtract the price of the lowest low from the highest high in the formation and then add or subtract that to your breakout price. A higher target can be measured by adding the price at the start of the move leading up to the formation to the lowest low, and then subtract that from the highest high in the formation. Since the former measure is easier, and more likely to be fulfilled, I will use that one.
Symmetrical triangles are good for intraday trading. Buy near the support line, sell near the resistance until break out occurs. Since I like to channel trade, it is helpful to be able to recognize these patterns so I can cut my loses when I end on the wrong side of a trade.
Now, lets get down to the nuts and bolts of this Google chart.
CLICK ON IMAGE TO ENLARGE

The first step is to identify the pattern. We see that GOOG has a symmetrical triangle confirmed as it has four touches to the top trend line and three touches to the bottom trend line. They are in the formation of lower highs, and higher lows. The price has crossed the pattern completely 4 times, and is on it's 5th leg in the upward direction.
While we can see a breakout in either direction, the overall look of the GOOG chart points to a slightly better chance at the higher break out. Combining the pattern with my resistance levels from Stock Consultant, I will call an upward breakout at 587 on the current pattern. While I am not expecting a downward break, I will be on watch for it below 543. Note that the longer that GOOG stays in this pattern, the closer the two break outs come to each other (since we will continue to make lower highs and higher lows until the break occurs). I watch the chart daily so I will adjust potential breakout watches as necessary.
Our target measure will not change from now until the breakout, so we can calculate it by subtracting our lowest low from our highest high.
602.45-524.77 = 77.68
Using our current breakout watch numbers, we can conclude that an upward break of the pattern at 587 would give us a target of 664.68. A break downward at 543 gives us a target of 465.32.
Concentrating on the more likely break upward, we have some resistance areas we will need to overcome. First is 600. That is a big psychological resistance to get through. It shouldn't be a surprise that 602.45 is the high point of our pattern. Next is our 5% failure number, which happens to correspond with the triple top confirmation point from January. The pattern will bust if we can't push through to 613.00 without a throw back. If it fails here, we will need to keep a close eye to see if it breaks downward. A lot of money could be made on puts if this pattern was to fail. Next we have a psychological resistance at 650 which corresponds to the double top confirmation line at 652.50.
Referring to stock consultant though, the only resistance they show between the breakout at 587 and conservative target of 665 occurs at 640ish. This is good news for our chart.
So, my watch points for an upward breakout are
1. 587
2. 600-605
3. 615-620
4. 640
5. 665
Go Google Go!

Saturday, June 14, 2008
AAPL, another study of EEDT and initial 3RV (three rising valley) study.
One of the posters on Ihub asked for some input on AAPL recently. When I looked at the chart, I realized that a double top was forming similar to FWLT.
Confirmation: First the price was trending upward before the formation commenced. There are two peaks, with the price difference between them 1.19%, which is within our 0-3% variance. The valley is 10.52% lower than the highest peak, which is within our 10-20% range for the valley size. Most importantly though, per the Encyclopedia of Chart Patterns the pattern is not confirmed as an Eve Eve Double Top (EEDT) until it closes below the confirmation price of 172.00.
On Friday, we did dip below that price of 172, even dipping as low as 165.31 at one point. However our closing came in at 172.37, so by the strictest of definitions this pattern has not yet confirmed. I'm not buying calls at this point, though, as if the market turns down again on Monday we could confirm at that point. Basically, as I see it this one is in for a good sized move from here, we just wont know which way until next week.
Highest peak is 192.24. Using that and our confirmation of 172 we can calculate the target if the formation confirms.
192.24-172.00 = 20.24/2 = 10.12
172-10.12 = 161.88.
Our target of 161.88 is very near the 200 day moving average of 161.05.
CLICK ON IMAGE TO ENLARGE

If this stock confirms, one play would be a short sale or put play to the 161.88 target area. There is very mild resistance at 167.70.
If this pattern busts or doesn't confirm a couple of things could happen. Either way, a call would be in order though. If we start moving upward, we will either meet resistance at or go through our peak at 192.24. If we see a white candle forming tomorrow, and can get in between 175 and 180, we could see a return of 6.80% to 9.85% if we have to sell at the 192.24 level. However, on average, busted double tops see a 70% gain on perfect trades, which would put our price target at 292.40! We have 3 areas of resistance to break through, but once we are through 200, there is nothing stopping AAPL from rising.
In fact, if you take a look at the lifetime chart on AAPL on a monthly basis, it has been downright parabolic, and from what little reading I have done on the three rising valley chart, this stock will continue to fly if it can break confirmation of 202.96.
If we do the measurement calculation for AAPL based on the 3RV formation, we get an even higher target price of over 370! Granted it will have taken several years for that formation to confirm, so my assumption is that it would take several years for that target to be reached. All in all though, if we can confirm with a close over 202.96, AAPL would have to look like a great addition to anyone's IRA.
CLICK ON IMAGE TO ENLARGE

Always perform your own due diligence before making any investment.
In Review, week ending June 13, 2008
Friday the 13th was the only bright spot in this dreary week. My trading account has taken a battering, mostly in my portfolio balance, which is down 22.5% from the beginning of June. Realized gains have also slid some, but are still up 7.95% for the month. This is because I did not close out of all of my open option positions by Thursday, and for the most part that was a bad idea. As expected time value has been greatly lost on many of my open option positions, and GS in particular moved the opposite direction that I needed it too. I do not know how many times I will beat my head against this wall, thinking this one time I will do better holding an option over Thursday night into Friday before expiry week. I lose every time, and yet I continue to make the mistake.
Between the battering my account has taken, and what I see as a large number of bad moves on my part these past few weeks has made me decide to step back a little from option trading, and concentrate more on studying the market, and making fewer plays, mostly equities. I am going to be doing an in depth analysis here of my FWLT play for those of you interested in watching along. A couple of other plays that I will be watching this next week are AAPL which so far has failed to confirm it's double top Friday, and TRA which has recently broken high out of a symmetrical triangle.
I've created a list of seasonal plays to start watching. I went through and picked only stocks with A ratings from Navellier's Portfolio Grader. You need a subscription to one of his newsletters to access this. I am currently subscribed to Blue Chip Growth. Like everything else, I use it mostly for ideas and guidelines, but the portfolio grader is a nice bonus. Rather than doing my own due diligence on the hundreds of stocks in a few sectors, I was able to plug my lists into the grader, and sort by rank. This narrowed me down to 22 stocks across the three sectors targeted for seasonal plays starting the end of July. Over the next week I will start evaluating the charts on the stocks. I will be looking for recognizable patterns of course using my  Encyclopedia of Chart Patterns
, but I also want to look at 2 year charts to see each stocks individual performance last year during the sectors "season". Once I've done that, I will start a daily tracking for seasonal plays. My goal is to get that started before the end of June.
I'm going into this week knowing that I will be looking at a blood bath on my stats by the end of the week, as open options expire worthless erasing my current realized gains. Because I will be scaling back my plays at the same time, I am hoping that my portfolios realized gains finds it's bottom for the month, and hopefully my account value found it's bottom this week (was down as much as 32.5% at one point). The good news is that I shouldn't have to withdraw any more cash for living expenses for the rest of the month, and my HTE dividend pays next week. That monthly dividend is always helpful.
Always perform your own due diligence before making any investment.
Thursday, June 12, 2008
Chart Education, Part 1 ~ EEDT (Eve Eve Double Top) ***Updated 6/18/08***

Well, I cracked open my Encyclopedia of Chart Patterns and quickly realized that this is going to be one of the best investments I have made to my career as a day trader. I heard about the book on Mike Anthony's Extreme Stock Charts message board at Ihub.
The book is a very comprehensive analysis of the different chart patterns that can show up in your stock charts. I have been flipping FWLT calls for awhile now, and just before receiving the book I noticed that a double top was starting to form. Because these calls are one of my largest positions I decided after reading through the first chapter to skip ahead and read about double tops. There are several different types of double tops. The one that I am seeing in FWLT is a called an Eve & Eve double top.
*****Identification: First of all, by definition a double top would imply that the price trend leading up to the pattern needs to be upward. 65% of twin peak patterns studded climb away from the pattern rather than dropping below the confirmation line. Tops should look similar. Valley between can vary, normally 10-20% difference. Tops should be similar price, 0-3% variance. Peaks separation generally 2 to 6 weeks apart. Lastly, confirmation must be met to be called a true EEDT pattern.
*****Confirmation: Price must close below the lowest low of the pattern valley.
Once you have confirmed that you have a EEDT you will want to determine your target price to decide how you want to play the pattern. Rule of thumb is to measure the distance between the highest and lowest pps between the peak and valley. Take that number and divide it by two. Subtract that from the confirmation price (lowest price per share of valley) and you have your target. This calculation works 73% of the time in a bull market, and 76% of the time in a bear market.
You can play the downside on this pattern, but playing the upside once the trend changes can also be very profitable. Also, as noted above 65% of twin peaks do not confirm, and price will rise on average 70% when the pattern busts out.
The information above is paraphrased from Encyclopedia of Chart Patterns.
Now, lets evaluate our FWLT chart.
Click on chart to enlarge.

Note: This chart was created during the trading day.
The first thing that you will notice with the chart above is that yes, we have an upward trending stock price leading up to our pattern. Our two peaks are similar in appearance, rounded at the top. The peaks are almost three weeks apart (12 candles, plus 7 weekend and holiday days), so our time frame is correct. The left peak (highest) is at 79.82 and the right peak is at 79.29. that difference of 0.58 is less than 1% difference, which is within our 0-3% variance. The valley low price is 71.36, which becomes our confirmation number. Valley is 10.6% of peak price, which is within the 10-20% norm for peak to valley difference. Today we closed at 70.82 which confirms our pattern.
Since our pattern has confirmed, our next step is to do the calculation that will give us our price target for the down trend.
(79.82-71.36) / 2 = 8.46 / 2 = 4.23
71.36 - 4.23 = 67.13
Based on this calculation 67.13 is our price target. One play would be to purchase some puts tomorrow morning at open. While I will probably do a paper play on this just to get a feel for playing this chart pattern, there are many reasons why I would not make this play. First of all, option expiration is next week, which exasperates time loss on option plays exponentially. Secondly the price difference from confirmation to target is fairly small. The difference is only a little over 5%. Since I try not to purchase options the first 30 minutes that the market is open, chances are that percentage will be greatly diminished before I was able to purchase the option. Finally there are several levels of resistance that FWLT would have to push through in order to achieve that 67.13 price target. On 5/12/08 the price of FWLT gapped up from 69.65. There is a possibility that this decline is just an effort to fill that gap before continuing the upward price trend. Next, the price has closed at support of 70.98 this is a very strong support (variance 1.99) for FWLT. The support level has been tested more than 3 times, with high volume and held. We also have the 50 and 200 day moving averages within that support variance at 69.45 and 68.98 respectively. This is going to be a ripe spot for mutual fund managers to pick this stock up for a run up.
Because of these strong support levels, and the huge upside potential I have decided that my play is to start making equity purchases of FWLT. I made a small purchase at 71.56 today, and may add to that if it dips to the target of 67.13 or below.
Update 6/13/08
"One play would be to purchase some puts tomorrow morning at open. While I will probably do a paper play on this just to get a feel for playing this chart pattern, there are many reasons why I would not make this play."
I did not even make this play on paper. FWLT gapped up from Thursdays close of 70.98 to open at 71.70.
"Because of these strong support levels, and the huge upside potential I have decided that my play is to start making equity purchases of FWLT. I made a small purchase at 71.56 today, and may add to that if it dips to the target of 67.13 or below."
I purchased about 1/2 of the position I was willing to carry on FWLT at 71.56. My target is 85.00. I will need to watch for resistance at 80, to see if FWLT is able to push through, or if a triple top forms. I also need to watch that it doesn't close below our confirmation line at 71.36.
The chart below lays out a few trend and support / resistance lines, which give an idea of where my targets and watch areas are coming from. Our close yesterday came close, but did not quite fill the gap on 5/12 from 69.65. 85 seems like a reasonable target which will net us approximately 18.75% profit on the trade. I may bank some profits at the 80 level though if it has too tough of a time breaking that resistance. Even to 80 we can net a 11.75% return on this trade.
Click on chart to enlarge.

Update 6/14/08
Before I start my analysis of a few other stock charts, I wanted to review a couple different time frames on FWLT. In the first chart, we are looking at a 10 day chart at 10 minute intervals. As you can see FWLT has broken out of it's downward trend.
Click on chart to enlarge.

Looking at FWLT's 2 year chart, you can see a similar double top failure around this same May-June time frame.
Click on chart to enlarge.

Assuming a purchase of around 51.50 when the chart pattern failed to confirm, to the top of the run completed during the first half of July, the stock priced gained 20.3%.
Update 6/16/08
The stock performed pretty much as expected today, making another leg up. We may meet some resistance here at 76.43, and I will be surprised if we touch 80 before option expiration, though it is possible.
Click on chart to enlarge.

Update 6/17/08
The stock closed with a red candle today, but above 75. Volume was low, about 45% of the average volume for the past 6 months. We are still in the upward moving channel, but I will be watching this one close tomorrow. A close under 75 could indicate that this was just a pull back on the double top formation, and there is more down side to be seen on this stock.
Click on chart to enlarge.
Update 6/18/08
The stock closed today with a white spinning top, which signals indecision in the market. I am expecting the stock to stay under $75 through option expiration on Friday. I will hold my current position, but would not suggest buying or shorting this stock at this point, it can still go either way.
Click on chart to enlarge.


Always perform your own due diligence before making any investment.
Wednesday, June 11, 2008
What can you say about this market except...
YIKES!!!
I'm emotionally back where I was in February when I took a break from day trading, while not quite financially. I've made some great realized gains, but not enough to offset the damage this falling market has done to my portfolio. So, I'm off the day trading for awhile, and back to the slow steady rebuilding of my portfolio value through accumulation of blue chip equities. While I will no longer be spending 8 hours a day watching level 2's, I do have a list of things that I will be doing.
First of all, I will continue to update my Day Trading Research blog. Like I did in February, I wont be watching the daily ebb and flow of my portfolio, but I do keep up with watching the channeling and changes, because I will be swing trading some equities to regain some lost grown.
Next I will be doing some reading. Today my Encyclopedia of Chart Patterns and I am going to start studying that. I have also ordered DeMark on Day Trading Options
and Options Trading 101
. While I think I have learned quite a bit in the past few months by trial and error, I feel it would behoove me to spend at least part of the time that I would have spent day trading to learn some more about trading options for when the market finds a little more stability.
Third, I will start researching my July Seasonal Plays.
Fourth, I am attending TD Ameritrade webcasts to learn about their new Options 360 trading platform.
Now, about those equity positions I will be swing trading. I will be watching the following stocks for buying opportunities, using the support and resistance levels from Stock Consultatnt to determine the best buy and sell points. Since I will be trading the equities, and do not have to worry about the time decay associated with options trading, I will be trading around a core position, selling a percentage of my holdings when I reach a resistance level, and purchasing more as I approach support. Of the 5 stocks I have listed below, I already hold some PCU and HTE. The stocks are listed alphabetically, and you should be able to click on the chart to enlarge it for easier viewing.
DRYS: Look for entrance near $60.00
FWLT: Look for entrance near $70.00
HTE: Look for entrance near $23.00
PCU: Look for entrance near $100.00
SOLF: Look for entrance near $16.00
I don't have charts saved for them, but POT and GOOG are also always on watch for accumulation opportunity.
Always perform your own due diligence before making any investment.
Sunday, June 8, 2008
Seasonal Plays
One of the sections of my Stock Traders Almanac regards seasonal sector plays. It is because of this section that I purchased the QQQQ calls in April, and have been trading them successfully ever since.
There are three seasonal index plays listed to start at the end of July. Biotech (BTK) play ends the begining of March and averages a 15.6% return the past 5 years, and 38.3% over the past 10. The Gold and Silver (XAU) play ends the end of September and averages a 20.8% return the past 5 years, and 20% over the past 10. Lastly, utilities (UTY) end the beginning of January and average 13.4$ return the past 5 years, and 20% over the past 10.
If you are not day trading, buying the index fund may work for you, however what I will be doing is finding a few stocks in each sector that I like, and follow them over the next few weeks to look at for day trades. Once I find them, I will start covering them in my Day Trading Research blog.
Always perform your own due diligence before making any investment.
Friday, June 6, 2008
In Review, week ending June 6, 2008
Oh my gosh, what a week! The market continues to be manic depressive, and the longer that it is the more we come to expect it. While listening to CNBC I heard at one point this week someone refer to the DOW being down over 100 points as a minor correction. It wasn't that long ago that would be a major event! Now the DOW needs to move closer to 300 points for anyone to start batting an eye.
But enough of that, now for my notes for the week.
My research blog has worked out well. I have gotten some good feedback from fellow traders at Ihub, and I am glad to share my work with them. One of the things that I decided was to try and earnings play this week. I had done a few earnings plays and found that the price of the options increased the closer time got to the earnings, a premium seemed to be built in. Running with that idea I made a few plays, and I have to say the results are less than sterling. What I netted from the experience was extra work time in research, distraction from playing positions that I know (the ones I have been watching daily for months) and a loss of 2.1658% assuming that the JTX calls that I am holding expire worthless (I didn't get the end of day out I was looking for, or the earnings I was expecting). While I don't normally like to give up on an idea so soon (I only gave it a week), I have decided that right now is not the time to continue on with that path at this time. I may try it again, but right now the market is too precarious to be adding a new play to my bag of tricks.
My goal has been to close my open option positions by June 12th. I have been holding a lot of red options that I picked up since I came back to day trading full time in April. When I have an open option position, I like to watch the level two of the option side by side with the underlying stock level two. This works out great for trading, but I was having a couple of problems. First of all, only one of my accounts has level two functionality, and with their platform you are limited to 6 level two's open at one time. That meant that I could only basically have full vision of 3 option plays at a time (and I usually have a few more than that going). Another problem that I had is that very often the option level two on Ameritrade would either stop functioning all together, or their would be a difference between what the level two was showing as the option price, and what was showing on other parts of the site. These problems had more than once caused me to make a bad trade just because I wasn't clear of what was happening with my option bid/ask.
A great person I met on Ihub that runs the The Lotto Pick Project was helping me out with level two's now and then when I asked. She was kind enough to lead me to the AlphaTrade trading tools, and I have to say I'm very pleased! I am currently only using the level two and charting functions, but even those are well worth the price of the service. I'm now set up with level twos on one computer, complete with awesome real time graphs and my Command Center for trading open on the other computer.
One of the great things about the graphs at Alpha Trade besides being real time is that you can pull up graphs for options as well as equity ticker symbols. I went for months without having access to option charts. I also recently found that Big Charts has option chart access for free. Anyway, at one point I realized that I was holding way too many option bags to keep an eye on all of them, so I spent a little time one evening and pulled up the chart for each of the options that I was holding, found out what the highest price was that the option had achieved in the past few weeks, and set a GTC (good til cancelled) bid. If something happened to the stock in after hours, I could always change the bid, but if there was some unforeseen spike in the underlying stock while I was paying attention elsewhere, I would fill for what I felt was a fair closing price. This was invaluable for helping me to eliminate some of my positions.
Overall my trading account value is down 8.16% month to date, but that of course includes part of my monthly "salary" which comes out the first week of the month. My trading account has seen realized gains of 7.99% so far this month.
In conclusion, here are a couple of new option links that I found that I will start looking into this week as round trip option trading resources.
Most Active Options
Options you should have bought
Option Chains
Always perform your own due diligence before making any investment.
Tuesday, June 3, 2008
Round Trip Options 6/2/08 to 6/6/08
I didn't have the opportunity to make too many round trip plays this week. The ones that I did all turned red, though the losses were very small. My concentration has been on closing out my open option positions before next Thursday in preparation for expiration week.
VIP calls .07 loss for 38%
SOLF calls .25 loss for 14%
SOLF puts commission loss, 1%
Always perform your own due diligence before making any investment.
Another rough day at the office.
Well, I closed out my first two earnings plays today. Unfortunately they both closed red. I guess it would have been too much to ask that I close green on a new trading strategy the first time I tried it.
I started grabbing GES calls yesterday. I could have gotten priced in better if I had waited until today. The market did a shake down in the after noon, and while stocks did recover some from their lows, it was not quite enough to get the interest going on my calls. Doing these plays I may actually be better off buying calls that are in the money, rather than going with the cheaper out of the money calls. It's hard to tell if my theory is bad, or if today was just an aberration due to the market sell off. I decided against my original plan of selling all of the calls at the end of the day, and kept 1/4 of my positions to hold into earnings, as the stock price was resting on a strong support level, and GES has had a couple of recent earnings surprises.
Well, so far that seems like it was a good idea. GES is up 8% in after hours. Of course that does not mean that it will still be up at market open tomorrow. IPI had blow out earnings recently but went down after earnings on Monday and still hasn't recovered.
The difference though is that GES and retail in general have been fairly beaten down recently, while IPI and fertilizer had already seen big gains before earnings release. We'll see what happens with that tomorrow.
VIP was my second option play. I broke one of my rules buying it though. I put a bid in at open, which filled and then immediately lost 50% value. I was fighting an uphill battle all day, and never recovered. As always I need to remember never to purchase options between 6:30 am and 7:00 am (market open to 10am market time). It bites me in the hiney 90% of the time.
I purchased some JTX calls yesterday. I had an opportunity to sell for 100% gain at one point today and didn't take it. Earnings are pre market on Thursday so I will be selling those before close of market tomorrow. I'll be back here to update this post with how that trade turns out.
My one round trip today was SOLF. It broke through resistance and I bought the calls for a round trip based on the bump in the squeeze rating between Monday and Tuesday. It didn't stay above that resistance long, and ended up plummeting with the rest of the market. I was tempted several times to average down, but had decided not to for a couple of reasons. First of all it was still over a dollar away from the next support level (which was a weak support anyway) and also because I just started tracking this stock. I have not had a lot of success playing the solar sector, despite the huge amounts of money other people seem to make with it. My timing with solars has been horrible, so I decided rather than averaging down, I would just ride the position out to see if I got the bounce I thought we would the last hour of trading. As it happens we did get that bounce, and I sold for a .25 per contract loss. The good part of this story is that because I stuck with my plan, my loss was less than it could have been. Had fear ruled me, I could have sold those options for a .65 per contract loss when the shake down occurred.
My favorite part of today was that I was able to finally add some ENER to my investment account. It's only a small position, as there is a long way down to a support level, but I'm happy to have it. I purchased the stock, as I'm still new to following this stocks fluctuations. I would have to have a really strong signal that the stock is moving in a particular direction before I try to round trip the options.
Always perform your own due diligence before making any investment.
Saturday, May 31, 2008
Daily Research Blog
I decided to start publishing my daily research. I like the flow of this blog the way it is, and did not want to break it up with the daily scans. In order to maintain the feel of this blog, I have decided to start a second blog devoted strictly my day trading research. If this is something that interests you, feel free to visit Day Trading Research: Daily Research 5/31/08.
Always perform your own due diligence before making any investment.
CNN: June could be crazy month for stocks
The annual revamping of the key Russell indexes at the end of the month could lead to a hectic shuffling of stocks by big investment firms.
May 31, 2008: 11:07 AM EDT
NEW YORK (AP) -- "The whole month of June is kind of a magic month."
Citi Investment Research equity strategist Lori Calvasina wasn't referring to weddings, graduations or wildflowers blooming. She was talking about the stock trading that will take place in the next few weeks in anticipation of the annual reconstitution of Russell Investment's indexes.
It may seem like a wonkish matter that few individuals would pay attention to, but the reshuffling of the stocks that make up Russell's indexes, including the widely followed Russell 2000 index of small companies, will have a big impact on stock and mutual fund holdings.
"Your benchmark index is going to change," Calvasina explained. Those changes will affect some $4.4 trillion in assets that Russell says is tied to one of its indexes, which were launched in 1984.
Citi estimates there were 120 funds passively linked to Russell's 26 U.S. indexes as of Dec. 31, holding nearly $535 billion in assets -- nearly five times as much as such funds held in 1999. Morningstar Inc. says there are 20 Russell 2000 index funds alone, among 246 that use the small-cap list as a gauge for their performance.
The managers of all those funds will have to adjust their holdings to follow the new lineup in the indexes. But before that happens, hedge funds and others will try to take advantage of the changes.
"Hedge funds are going to try to game this," Calvasina said. "To a certain extent it's already been happening."
Wall Street analysts have been pumping out notes on a near-daily basis with their educated guesses for which stocks will be added, deleted or moved between indexes.
They are able to come up with fairly accurate lists, because Russell makes its methods for picking the stocks in its index public, unlike, for instance, Standard & Poor's, which uses a committee system to develop its S&P 500 and other indexes.
Here's how it works: At the close of Friday's trading, Russell Investments will take the first step of the reconstitution by taking a "snapshot" of approximately 13,000 stocks traded on U.S. exchanges.
It ranks the companies from largest to smallest, and filters out those that don't meet its criteria, including companies not based in the U.S., stocks that trade below $1 or those that trade over the counter, or on what are called the Pink Sheets, which do not need to meet minimum requirements or file with the Securities and Exchange Commission.
After factoring in a few other matters, the largest 4,000 companies are picked to be part of the Russell 3000E Index, which represents approximately 99 percent of the U.S. equity market. All its other indexes are subsets of this master list; for instance, the biggest companies become part of the large-cap Russell 1000, while Nos. 1001 through 3000 make up the Russell 2000.
The Russell 2000, has had a difficult year, falling about 12 percent since 2007's reconstitution. One reason has been the overall weak market performance, especially in financial stocks, which at 20.6 percent make up the single largest sector in the index.
With so many stocks falling, one sure thing is that the market value of the companies that make up the small-cap index will be smaller than last year.
Melissa Roberts, senior vice president of quantitative research at Keefe, Bruyette & Woods, estimates the market caps of the new stocks in the Russell 2000 will range between $165 million and $2 billion, a dramatic fall from the $261 million to $2.5 billion range last year.
She said that along with market weakness, the big decline reflects a large number of companies that were dropped from the list in the past year due to buyouts and delistings, and some changes Russell made to its methods for including stocks.
Overall, she expects 312 new companies will be added to the small-cap index, including 42 companies dropping down from the large-cap list. Keith Miller at Citi put his estimates at a total of 307 additions, with 40 stocks falling from the 1000 to the 2000.
Because analysts and others can be so specific ahead of the actual reconstitution, the stocks in question could see some hectic trading in the coming weeks before the final lists for 2008 are released June 27.
Find this article at:
http://money.cnn.com/2008/05/31/markets/bc.na.fin.mkt.us.wallst.ap/index.htm
Always perform your own due diligence before making any investment.
Friday, May 30, 2008
Off Topic ~ Free Hugs
This hug's for you!

http://www.youtube.com/watch?v=vr3x_RRJdd4
All the Same ~ Sick Puppies
I don't mind where you come from
As long as you come to me
But I don't like illusions I can't see
Them clearly
I don't care, no I wouldn't dare
To fix the twist in you
You've shown me eventually what you'll do
I don't mind
I don't care
As long as you're here
Go ahead and tell me you'll leave again
You'll just come back running
Holding your scarred heart in hand
It's all the same
And I'll take you for who you are
If you take me for everything
And do it all over again
It's all the same
Hours slide and days go by
Till you decide to come
However long you stay is all that I am
I don't mind, I don't care
As long as you're here
Go ahead and tell me you'll leave again
You'll just come back running
Holding your scarred heart in hand
It's all the same
And I'll take you for who you are
If you take me for everything
And do it all over again
It's always the same
Go ahead say it
You're leaving
You'll just come back running
Holding your scarred heart in hand
It's all the same
And I'll take you for who you are
If you take me for everything
And do it all over again
It's all the same
Always perform your own due diligence before making any investment.
May Performance
On May 16th I made a post which included a mid month recap of my monthly goals. I was easily exceeding most of them, and was looking forward to tying up a few loose ends and having a fairly stress free couple of weeks... Well, if you follow the market at all, you realize that didn't happen!
Below are my final results for May, which take into account commissions and margin interest. As a reminder, I have decided to base my monthly goals on portfolio value.
Account % . . . . . Goal. . . . . % Actual
Trading . . . . . . . . 25% . . . . . . . . 5.65%
Investment . . . . . .12% . . .. . . . . 5.18%
IRA . . . . . . . . . . . . . .8%. . . . . . . . . 5.40%
As you can see, I did not make any of my goals for the month as far as my portfolio balance goes. Of course those results (all gains, just shown in red because they did not meet the set goal) are nothing to sneeze at. They translate to annualized returns of 67.8%, 62.16%, and 64.8% respectively.
While I am not setting realized gain goals, I am also tracking those. For the month of May my realized gains are as follows.
Trading . . . . . . . . 28.85%
Investment . . . . . 11.2%
IRA . . . . . . . . . . . . 1.72%
I really could not be more thrilled at this point. Those numbers translate to annualized percentages of 346.2%, 134.4% and 20.64%. Obviously I am not going to see these type of gains every month. In fact, I expect June to be really rough. I will probably not take advantage of every trading day with hubby on vacation, and of course I obviously am carrying a lot of unrealized losses over into June. I have a lot of open option positions that I need to close out in the next 9 trading days, and if the market doesn't cooperate, I'm in for a rough ride.
As I have probably mentioned before I have a set group of stocks that I track daily so that I can learn their rhythms for options trading. These include PCU, POT, DRYS, RIMM, FWLT, GS, and GOOG. Another thing that I track during the month is my trades in these stocks. Some of these trades are equity trades and some are option trades, and they have happened across all three of my accounts. Below is a list of the good trades per total trades for the stocks on that list that I traded in May, and whether there was an overall gain or loss in trading that stock. They are ranked best to worst by dollar amount gained/lost.
GOOG 10 for 11
FWLT 9 for 9
DRYS 8 for 11
PCU 2 for 2
GS 2 for 4
POT 0 for 2
These 6 stocks accounted for 69.98% of my realized gains for May.
There are a few key things I have learned over my past 7 months as a day trader that I need to remind myself of.
*First and foremost, close ALL option positions the Thursday before option expiration (for the upcoming month that is June 12th).
*During option expiration week limit any option trades to round trips. The majority of trades during options week should be equity trades.
*FOOLS RUSH IN...do your own due diligence before opening a position. If you don't have time to make a few basic checks before entering a position, then you don't have time to watch it once you make it.
*No Fear, No Greed...the bears are in control, and are ready in willing to shake the fearful out of their positions. Know your support and resistance areas, including type, strength and variance. Hold firm to positions pushed to the limit, but do not be afraid to take the loss once they push through. There is always another trade to be found.
*Research all positions daily for changes. My daily research includes closing price, after hours price and news, chart, short interest, market sentiment, support, resistance and possible break outs.
*Begin each month knowing if there are any days the market is closed. Market holidays should be treated like expiration days, close out all open option positions a week before the holiday, and limit option plays during the week proceeding the holiday to round trips. June does not have any market holidays, however the market closes early July 3rd, and is closed on the 4th. Option expiration is June 20th. This means that all option plays picked up beginning June 23rd need to be closed by Thursday, June 26th.
I have decided to keep my current goals through the end of August for a couple of reasons. First of all, as mentioned above, I am entering June with a lot of unrealized losses on the books, and may not be taking advantage of trading every day. Unless the first half of June is as remarkable as the first half of May was for me, I am going to have a difficult time making these goals in June. Therefore, I want to continue to reach for the sky with these lofty goals through August to determine if I am able to achieve them once I get back in the day trading groove. At the end of August I will evaluate my performance and adjust my goals accordingly for September through December.
Have a great weekend, and Happy Trading!
Always perform your own due diligence before making any investment.
Round Trip Options May 19 - May 30, 2008
Despite having a lot more option positions than I prefer this month, I was able to round trip a few more options. Here is how they faired.
DRYS PUTS gain .70 for 18%
RCH CALLS loss .20 for 43%
DRYS PUTS gain .80 for 15%
PCU PUTS gain .85 for 44%
GOOG PUTS gain 1.00 for 23%
DRYS calls .50 loss for 10%
Overall I am pleased with the performance of my round trips for the month. June option expiration is Friday June 20th. My husband will also be taking vacation from June 23rd through July 4th. My goal is to close out all of my open option positions by Thursday June 12th in order to avoid the accelerated time decay of options week, as well as allow myself the freedom to trade or not as I please while Hubby is off work.
Always perform your own due diligence before making any investment.
Wednesday, May 21, 2008
DOW down 427 points in two days!
What a crazy week so far!
I realized on Tuesday the market was going to be weird this week, with the upcoming holiday coming. I can't predict how Friday will go, but it will probably be low volume, and highly manipulated. In the mean time, I'm working on closing out as many option positions as I can before then, and get back to being more strict with the options day trades.
Visit my round trip options board if you are interested in keeping up with my plays as they happen.
Always perform your own due diligence before making any investment.
Saturday, May 17, 2008
Roundtrip Options May 1 - May 16, 2008
Well, I got back to making a few round trip options plays this month. This is how I have fared so far.
DUG calls .60 gain for 65%
PCU calls .70 gain for 10%
FWLT calls .50 gain for 16%
EXM calls .50 gain for 25%
Visit my Roundtrip Options board. We have a few new assistants on board that will help bringing some options trading ideas for quick trades.
I will try to get back into the habit of documenting Round Trip Option plays each week.
Always perform your own due diligence before making any investment.
Friday, May 16, 2008
Everything happens for a reason...
I found out today that had I stayed in my full time job (I went part time in Feb '07 to spend more time trading, then quit the part time position in October '07 to trade full time.) I would have been laid off on Monday. Just thinking about all of the things I would have given up had I stayed in that job the additional 14 months before the inevitable lay off gives me a deep appreciation for my position. That first decision in February to go from full time to part time started my destiny into motion. The fact that I started trading at the beginning of a bear market gave me a crash course in how brutal the stock market could be. I've learned that being too cautious is as detrimental as being too greedy. I learned that the market makers will rule you through your greed and fear if you allow them to. No fear, no greed, is so important.
The big story so far this month has been oil, which has sent one of my favorite stocks HTE on a run. Close of day 5/1 HTE traded at 21.83. Close of day today (option expiration) it traded at 25.55. That's a price increase of over 17% in just 12 trading days! Not to mention (yet again) the .30 per month dividend.
The option stars for me so far in May have been V, FWLT, and GG calls. All traded or currently held between 100% and 400% gains. In realized gains V barely edged out FWLT, but FWLT shares I am holding continued to gain while my V options are basically the only red in my trading account. My big losses were POT calls (I should have bought out a month further) and my DRYS puts. That could have been a huge gain if I had bought the calls instead.
Looking at the two year and lifetime charts on POT, I find it hard to believe that I can lose money on call options, but I do. Long term this one is a no brainer though. I have a few swing trade stocks in my IRA that I will convert to POT as I take profits.
LIFETIME

TWO YEAR

I was a little late making my goals for May. As you may know my trading has been limited between February and now based on market conditions and my bathroom remodel. Anyway, about a week ago, I decided to set some goals through the end of the year. I decided to go with a portfolio percentage increase each month, taking into account the money that I need to remove each month from my trading account in order to meet our household obligations. I created a spread sheet that is linked to my "scorecard" where I keep my high level stats for my three accounts. This spreadsheet will automatically adjust the next months goal based on the previous months final balance, so I am set through the end of the year. If I decide my goals are unrealistic, I can easily change the formulas to adjust based on new percentage gains projections.
My goals and current status as of 5/16/08 are
Account % . . . . . Goal. . . . . % Actual
Trading . . . . . . . . 25% . . . . . . . . 29%
Investment . . . . . .12% . . .. . . . . 15%
IRA . . . . . . . . . . . . . .8%. . . . . . . . . 7%
I will be keeping an eye on GOT this week. It has been consolidating since mid April, has had some insider buying and may get a pump soon with the rest of the retail sector.

At this price, a 50 % gain is reasonable once the stock starts it's upward move.
Always perform your own due diligence before making any investment.
Thursday, May 15, 2008
Hot IPO's
I am currently invested in three IPO's. The first V I have discussed here before. It has been down a bit this week, with option expiration coming, but staying within the upward bound trading channel. I've heard predictions of 100 before the end of the month. I'm not sure if it will go that high that fast, but we will definitely see 90. I have been collecting V in my IRA, and have gathered a lot of June 100 and 110 calls. I held them through the expiration week, so I've had some time decay, but with the flips I did before this week, I'm still green over all on V trades, and looking to score big in the coming weeks.
The next IPO I am trading is IPI. Intrepid Potash has been channelling between 46 and 52, and I bought a few June 55 calls to make a short term trade. My first target is 100% gain.
The last one is a little risky, but I made an extremely small purchase (less than 100 shares) of CFX. I have it in my investment account. I got in on a dip today at $23.75. I got tired of watching it go up a dollar or more each day without me!
Always perform your own due diligence before making any investment.
Subscribe to:
Posts (Atom)