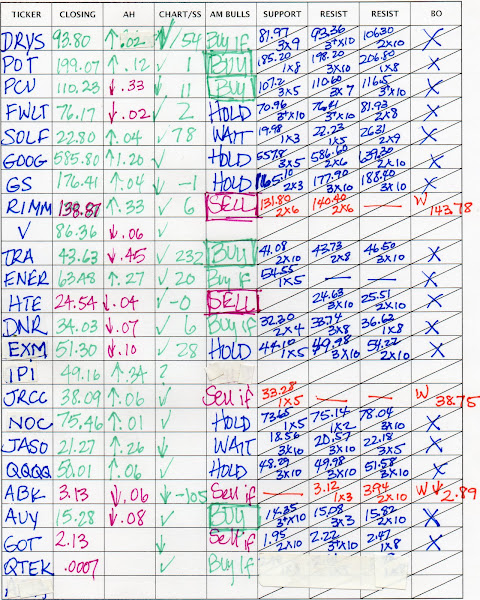
The market has been in an incredible uptrend, and I find myself in the position of holding too many stocks, 15 of them as of last night. I know that I need to get out of at least 5 of these positions. For a part time investor as myself, 10 seems to be a pretty fair number positions to keep track of. Some of my positions I consider low maintenance at the moment, but last night, between starting this blog I created a spread sheet of a few of the positions that I would like to get out of as gracefully as possible. Here is a a view of it, with the exact costs blacked out protect my privacy. (Right clicking the chart gives you the option of opening it in a new window).
Anyway, there are several possible points at which it may be a good idea to sell a stock. The first one I have listed is 10% loss. This is the point where you have lost 10% of your initial investment. You can use whatever number you are comfortable with. Sometimes I will allow a stock to dip lower, if it makes sense to, but I use the 10% as a rough guide that I am comfortable with. Here is some interesting information that I picked up at a class that I took. The information below tells you, based on a set amount of money, if you lose a certain percentage of one investment, the get even point of your next investment.
% loss of initial trade % gain needed on next trade
10........................................... 11
20........................................... 25
30........................................... 43
40........................................... 67
50........................................... 100
60........................................... 150
70........................................... 233
80........................................... 400
90........................................... 900
So, if you have 1000 dollars to invest, and you lose 10% that leaves you $900 for your next trade. You will have to make 11% on that trade to return to break even. As you can see by the chart above, the get even point becomes exponentially more difficult to achieve as your loss percent of the first trade increases.
The next column I have for a sell point lists the 15 day low. The idea behind this comes from the "Turtle Strategy"*. A successful futures trading strategy that was kept under wraps, until one of the "turtles" divulged the secret. This is a trend investment method, where you buy a stock when it is at a 20 day high, and sell it when it is at a 10 day low. Once this secret broke out many people were using it, so soon the market movers were forcing stocks to 10 day lows to buy stock at a bargain. Picking a random day close to that range is one way to avoid being sucked into that cycle, and still get out of a stock when it is on it's down trend. I am currently using 15 days, in hopes of avoiding selling too soon based on normal market fluctuations. This number of days fluctuates for me, but the principal is the same.
The third sell point I am looking at is the stocks support. This is the point on the graph that it appears the stock is able to stay above. In the case of PWAV (I will post the chart further down) I have a horizontal support line, but that is not always the case.
Because I am working part time, and I have so many stocks to watch at once, I then went into my Ameritrade account and set up e-mail alerts for each of the stocks on the list based on one or more of those 3 criteria. This way, whether I am at home or work, I will receive an e-mail when one of these three stocks cross that threshold.
If you have my spreadsheet open, you will see that PWAV has a 10% loss at $6.03, a 15 day low of $5.97 and support at $6.00. As you can see, all signs are pointing to me selling this stock if its price gets any closer to the $6.00 mark, so I made that my trigger. Sure enough, the e-mail came for me at work that the line had been crossed. I made the decision to sell the stock, I put in a market order, and got out at 5.992.
Let's look at the PWAV chart for the past year. Right click on the chart again if you would like a better view.
I will apologize now for my abhorrent paint skills. The green arrow shows you where I purchased this particular stock, on May 4th. This happened to be one of the first stocks that I found after learning about the Turtle system. I used Ameritrade's stock streamer to give me a list of stocks under 10 dollars a share that were in an upward trending mode. I liked what I saw on this stocks chart. It had just reached the highest high in several months, and the Displaced 10 day moving average had crossed up over the Displaced 50 day moving average. It was well above that line, and had been for a few weeks by the time I purchased it. It had a good run upward, peaking at $7.64 on August 8th. The purple horizontal line is what I considered support when I was looking at the chart last night. Had I reviewed this chart earlier, I would have placed support a little higher, probably around 6.25.
The stock gapped down on September 19th based on this article.
SANTA ANA, Calif.--(BUSINESS WIRE)--Powerwave Technologies, Inc. (NASDAQ:PWAV - News) today announced that it has priced its previously announced private placement of $130 million aggregate principal amount of convertible subordinated notes due 2027. In addition, the initial purchaser of the notes exercised its option to purchase an additional $20 million principal amount of the notes.When a stock gaps down like that, I don't like to jump on the band wagon. I like to wait a few days, and see how it plays out. Sometimes it is just people panicking, sometimes it continues downward. Since the gap down, the stock went under the support line twice, and third time is often the charm. It may go up, but based on the way the chart looks now, and my need to get out of several of my current positions, I used this opportunity to sell PWAV today. This is not a stock that I plan to revisit anytime in the future.
http://biz.yahoo.com/bw/070919/20070919005371.html?.v=1
One of the things that I have noticed over the past month or so of watching my stocks during this volatile market, is that the stocks seem to trade lower between 11 and 1 Eastern time. Below is todays chart of PWAV for an example.
I didn't consider this when I put in my market order to sell PWAV, since I was at work.

As you can see by the chart, I sold PWAV at the lowest part of the day. While the dollar amount difference between selling then and a couple hours later is miniscule for this trade, (about 11 cents a share in this case) for higher priced stocks, that difference can be much more substantial, so it is worth noting here for my future reference.
Once I had my
 moment, I went out to Amazon, and put my order in for the Stock Trader's Almanac 2008
"The Stock Trader's Almanac is a practical investment tool that has helped traders and investors forecast market trends with accuracy and confidence for over 40 years. Organized in an easy-to-access calendar format, the 2008 Edition contains historical price information on the stock market, provides monthly and daily reminders, and alerts users to seasonal opportunities and dangers. For its wealth of information and authority of its sources, the Stock Trader's Almanac stands alone as the guide to intelligent investing.All in all, even though I lost money on this trade, I would still call it successful. I am not unhappy at the point I got into the stock, and I believe that I gave it a good chance to show what it could do. The system I used to trade this stock is meant to maximize gains, and minimizes losses. All in all, I believe that objective was achieved, and a few inexpensive lessons were learned.
* To learn more about the Turtles, here is a link to Russel Sands website.
Way of the Turtle by Curtis Faith

No comments:
Post a Comment